Application guide
Karel the Turtle Application Guide
Application guide
Karel the Turtle Application Guide
Application guide
Karel the Turtle Application Guide
Application guide
Karel the Turtle Application Guide
Application guide
Karel the Turtle Application Guide
Application guide
Karel the Turtle Application Guide
Application guide
Karel the Turtle Application Guide
Application guide
Karel the Turtle Application Guide
Application guide
Karel the Turtle Application Guide
Karel the Turtle Application Guide
‘Karel’ is a PILA application that measures students’ computational problem solving skills. The application asks students to build programs in a block-based visual programming interface in order to instruct a robot in the form of a turtle (“Karel”) to perform certain actions. Karel understands four basic instructions: “move forward”, “turn left”, “place stone”, and “pick-up stone”, in a grid-like world. These programmed actions can be seen as abstractions of various navigational problems in the real world.
In the Karel application, students will first complete a tutorial and a series of short, scaffolded tasks where they are introduced to the environment (i.e. visual programming interface) and learn some of the basic concepts involved in computational problem solving. Students then progress to more complex and open-ended challenges where they have to apply simultaneously multiple skills and concepts.
The Karel application has a “low floor and high ceiling”, meaning students who have minimal programming knowledge and/or computational thinking skills can nevertheless productively interact with the environment because of its intuitiveness and simplicity (i.e. low floor), while at the same time this same environment allows for the design of high complexity tasks that can challenge even expert programmers (i.e. high ceiling). The application accomplishes this by using a block-based programming environment.
Key elements of the digital environment
The Karel assessment application is composed of a visual block-based programming interface and the ‘task hub’. Figures 1 and 2 show the current design of these two interfaces.
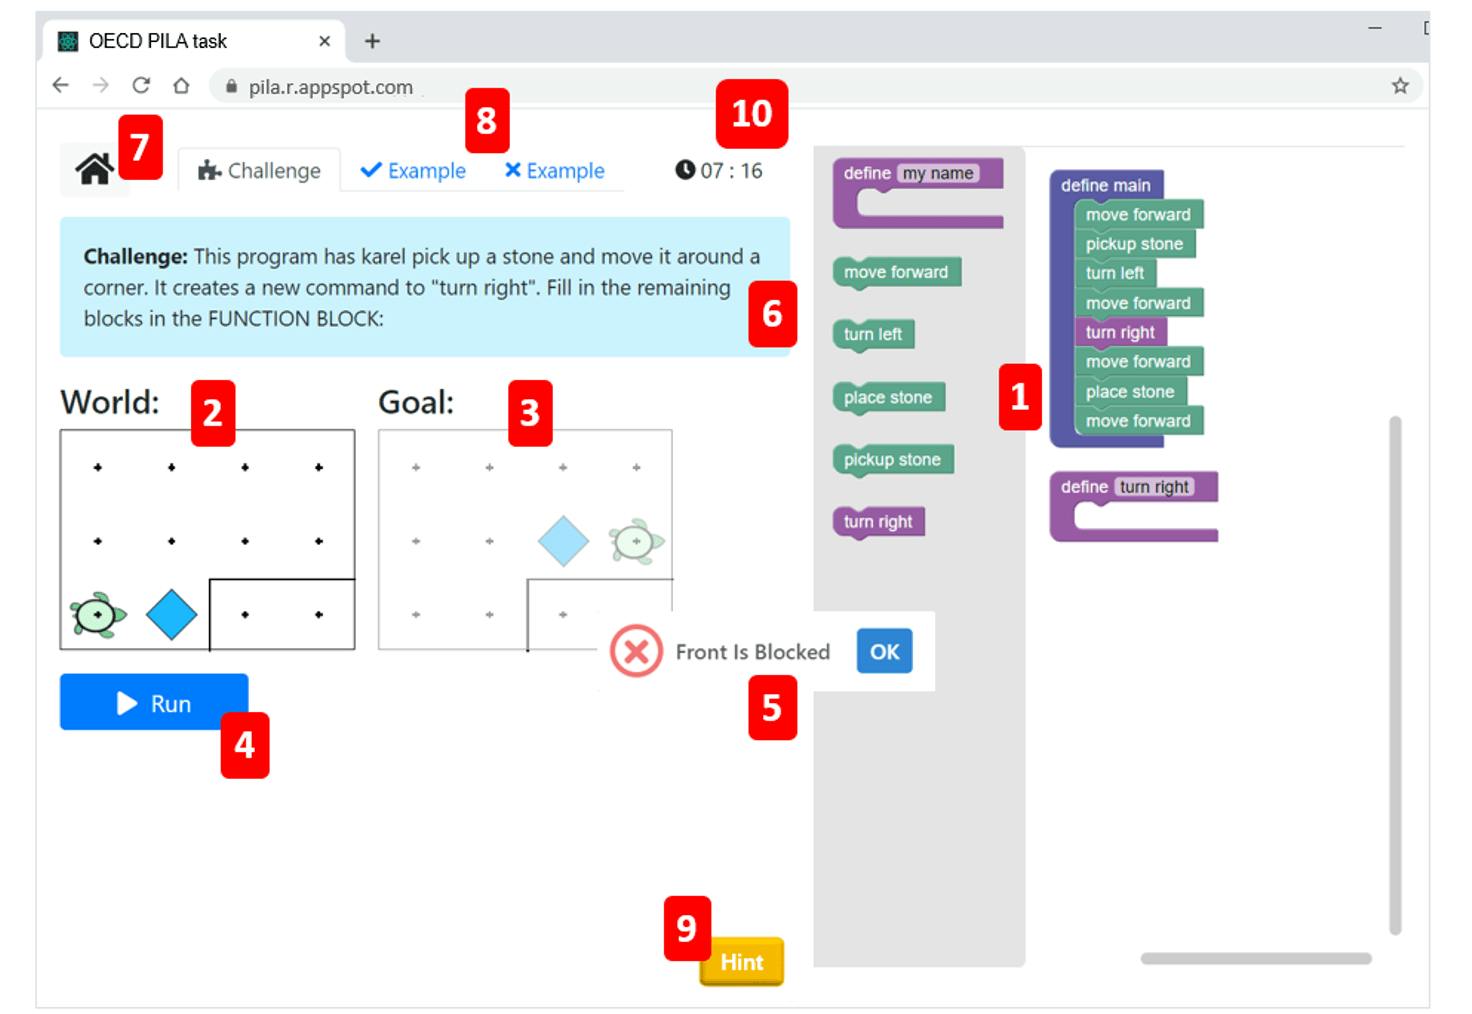
Figure 1. Block-based programming interface
1. Block-based program builder: Students can drag and drop pre-defined blocks of code into the program builder in order to build programs that instruct Karel. Students will have access to a certain set of block types and functionalities according to the design of a given task.
2. World state: This is the grid-like world within which Karel the robot lives and executes actions. Each cell in the grid can be empty or contain a finite amount of stones. Cells can be separated by a wall that blocks Karel from moving forward. The world state shows the current arrangement of stones and walls, and the position and orientation of Karel. The program that students build and ‘run’ will result in the world state changing, modelling Karel’s behaviour in the world.
3. Goal state: This is the desired state of the world, which is defined by the arrangement of stones and walls, and the position and orientation of Karel.
4. ‘Run’ button: The run button allows students to execute the program in the program builder as a simulation of Karel’s behaviour in the ‘world’.
5. Pop-up messages: These messages automatically appear after the student tests a program to communicate errors (e.g. ‘front is blocked’ or ‘your program is empty’) or provide feedback (e.g. ‘not quite’ or ‘success’) to the student.
6. Task instructions: Task instructions succinctly state what students must do in the task and what the desired goal is. The goal can also be represented visually, displaying the desired final state of the world upon task completion (see #3).
7. Home button: This button allows students to return to the task hub (see Figure 2 for an example of the task hub).
8. ‘Worked examples’ tabs: The worked examples illustrate a similar task, providing one ‘good’ example that demonstrates a possible approach to solving the problem and one ‘bad’ example that demonstrates a typical mistake.
9. ‘Hint’ button: The hint button provides students with a hint system guiding students on how to successfully progress through the task.
10. Time remaining clock: This provides students with an indication of how much time remains to complete the task.
The ‘task hub’ (Figure 2) allows students to navigate between tasks. As students complete tasks, new tasks become unlocked. Learning tasks (e.g. tasks 1-6 from the top in Figure 2) aim to introduce specific concepts and help develop the target skills throughout this ‘phase’. Once the students complete the targeted number of learning tasks, the challenge task will be unlocked. The challenge task is a complex, open-ended task that will ask students to apply what they practices in the previous tasks.
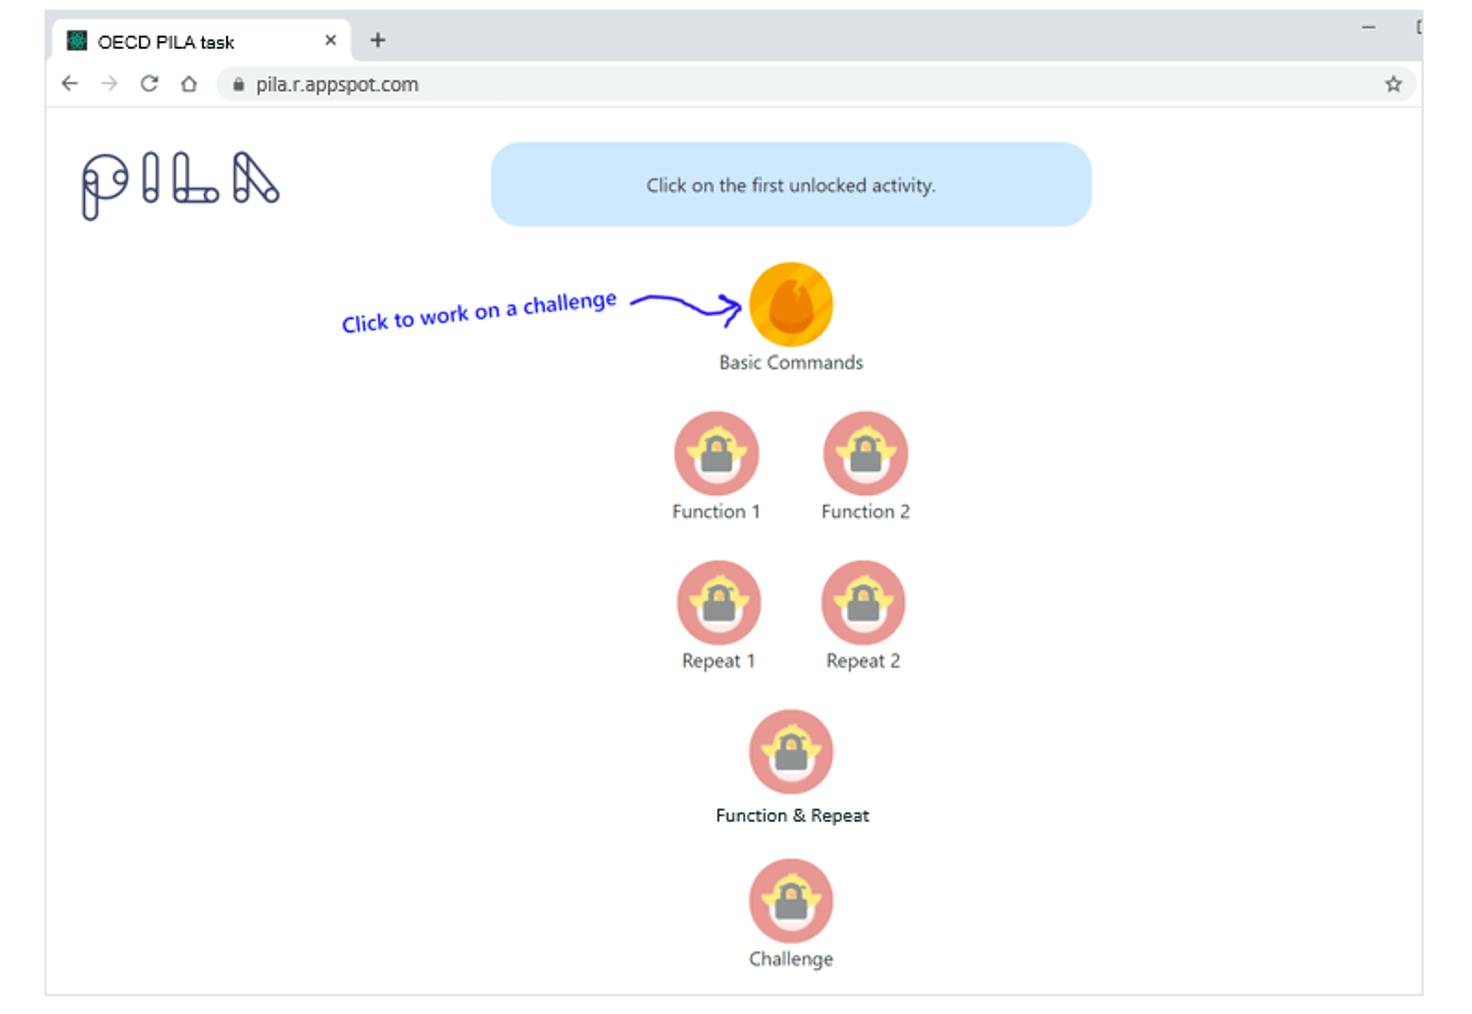
Figure 2. Task Hub
What skills can we assess with Karel?
The tasks in the Karel application have been designed to provide evidence on the computational problem solving skills described in the PILA Computational Problem Solving Framework. Each task is mapped to a given cell in the evaluation rubric presented in the Framework. Students’ capacity to solve a given task in Karel is considered evidence that they can do what is described in the corresponding cell of the rubric.
Here are a few examples of the evidence that can be collected from Karel for each of the skills:
Decompose Problems
- The student can identify and put in the right order relevant sub-goals for a given problem from given lists of sub-goals
- The student can use a drawing tool to indicate different trajectories that Karel can follow in the world to collect all the stones*
Recognise Patterns
- The student solves a problem that requires using nested repetitions
- The student can tag repeating patterns in the world using a drawing tool*.
Generalise Solutions
- The student can design a program that achieves the goal state in multiple different worlds
- The student saves functions in a function bank and uses them across different tasks*
Systematically Test and Debug
- The student can fix an erroneous program
- The student tests the program in chunks as they work
*under development
What information can teachers expect on how students manage their learning and stay engaged?
In addition to demonstrating their proficiency with computational problem solving skills and associated concepts (sequences, conditionals, loops and functions), students will need to be capable of effectively regulating their work on the digital platform, and maintaining an adequate level of engagement during the assessment experience.
We provide an indication for the information that will be collected on the way in which students:
Use resources
- The student accesses a worked example after making at least one attempt to build a program
- The student requests a hint after attempting to solve the problem
Respond to feedback
- The student performs actions that are consistent with the automated feedback (for example, the student reduces the number of blocks in the program after receiving the feedback that the program could be more efficient)
Evaluate own performance
- The student correctly evaluates his/her own performance in the challenge task.
Stay engaged
- The student does not remain inactive for long periods of time (e.g. more than one minute at a time)
- The student reports feeling engaged during the task
How can teachers use Karel?
There are three principal ways in which teachers can use the Karel application, which include:
- Assessment experiences defined by experts that teachers can assign to their class to complete during classtime or as homework. These experiences typically last around one hour. They contain a meaningful sequence of tasks that make students practice a defined set of skills and concepts, and progressively increase in difficulty. Teachers can assign their students multiple assessment experiences, possibly intervalled with other teaching practices (e.g. additional lessons, class discussion, etc.), and examine the extent to which students make progress from one experience to the next.
- Assessment experiences defined by teachers with the PILA Assignment tool. This tool allows teachers to combine discrete tasks that have been developed by experts, other teachers/researchers, or the teacher themselves (using the Karel Task Customiser tool; see #3 below), in order to create tailored assessment experiences for their students. Teachers can design new assessment experiences that, for example, have alternative sequences of tasks of varied difficulty, focus on one specific concept or skills, or span a desired length of time (e.g. a 20-minute experience that comprises four 5-minute discrete tasks).
- Assessment tasks defined by teachers. The Karel Task Customiser tool allows teachers with no programming experience to create their own task by modifying an existing task. By using the tool, teachers can modify several parameters, such as the task instructions, the world and goal states, and available learning resources. Any new task that is created through the customiser tool will automatically contain the necessary data collection capabilities, ensuring information on student performance can be displayed in the digital dashboards for teachers and students to review.
The tasks in Karel are classified according to the computational problem solving skills they target, their level of complexity, as well as the task type (see below), creator (e.g. PILA expert) and the characteristics of a solution that an expert would formulate. Each task created in the module has to include an ‘expert’ solution, and this section of the metadata is populated automatically extracting features of the expert solution. Task authors can also provide a short description of the task.
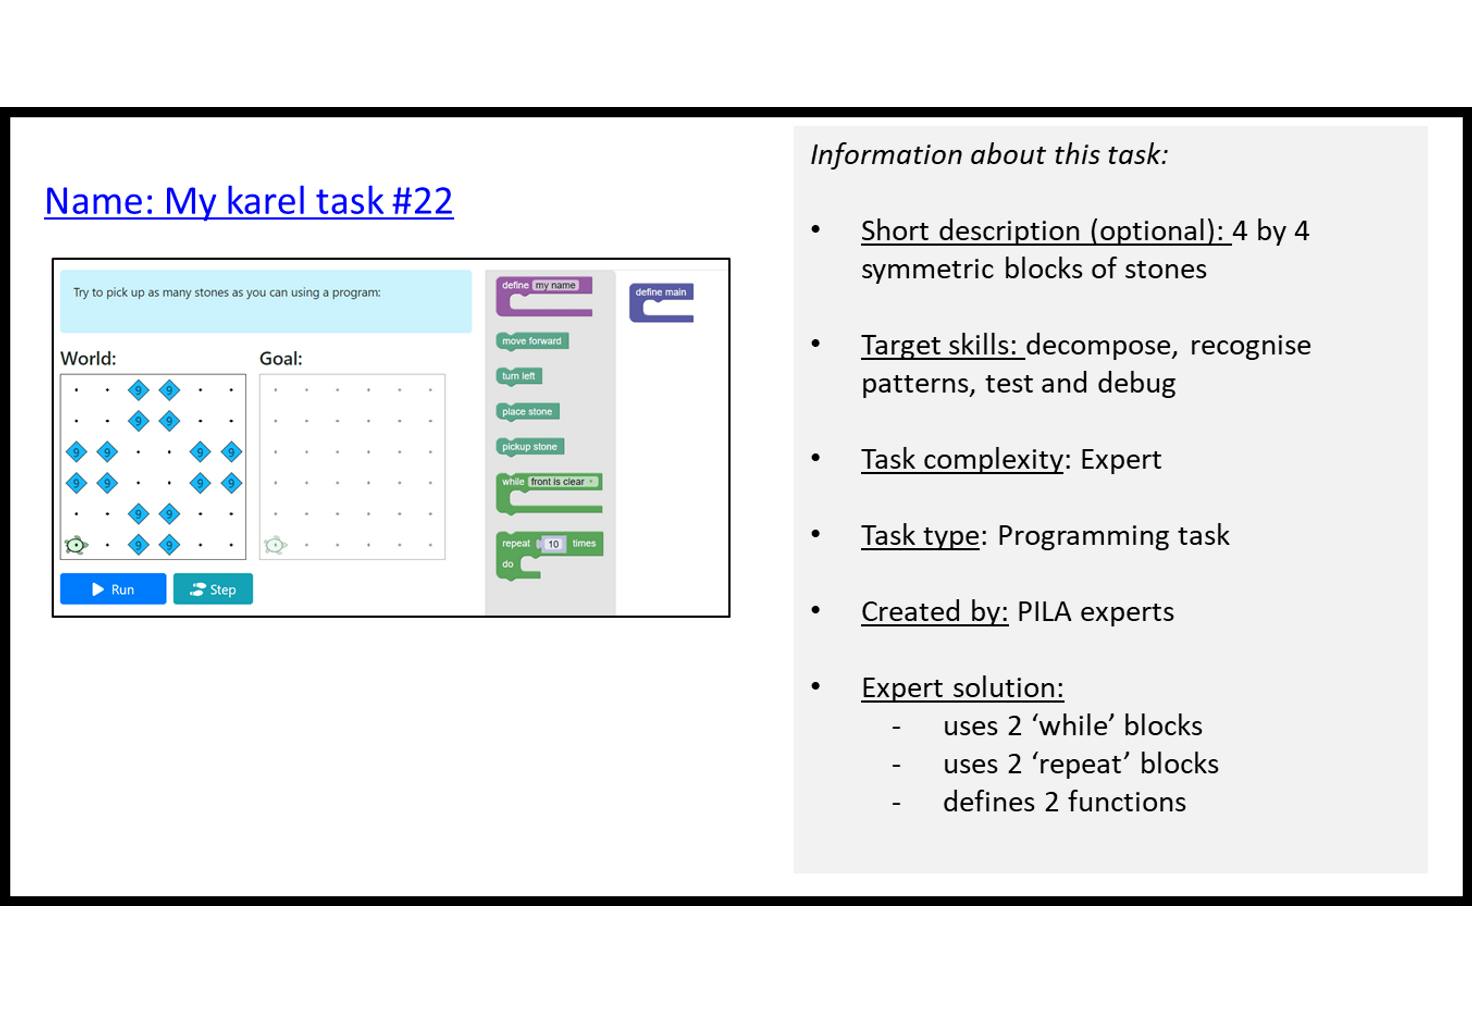
Figure 3. Metadata for Karel tasks
Karel Task Types
The PILA computational problem solving module includes several types of tasks designed to assess computational problem solving as defined in the framework. Here is a short description of each task type in this module, and examples that are being implemented in Karel World:
Open-response or multiple choice questions
- With a given program and initial world state, the student is asked to predict the goal state;
- With a given initial world state and goal state, the student is asked to infer from a list of programs which program would produce the goal state;
- With a given initial world state and “functioning” program for one goal state, the student is prompted to select from a set of alternative goal states the one(s) that can be accomplished with the same program;
- With a given erroneous program, the student is asked to identify one (or more) errors;
- With a given program with numbered lines of blocks, the student is asked to describe what a selected set of lines accomplishes in the world.
Programming tasks
- Build a program from scratch with a combination of the following affordances:
· Move Karel;
· Pick up/Place stone;
· Repetition block (run the inside function [x] times);
· While statement;
· If/else statement;
· Create a custom function (with a label) - Complete a partially-built program;
- Fix an erroneous program;
- Modify a program to adjust to different goal states in the same or different worlds.
Parson’s problem - All of the blocks of the program and the number of times they need to be used are defined but the blocks are not arranged in any specific order. Students are asked to arrange the blocks to create a functioning program. The task may include visual blocks or natural language to represent the discrete steps.
Coming in 2022:
Draw in the world - Students are prompted to decompose the problem visually, for example by drawing walls around certain regions of the grid, or by drawing the shortest path that Karel can follow to collect all stones.
Black box simulations - With a given “black box” function (i.e. a function block that students can use but that does not reveal what it does), students are asked to use the Karel environment and additionally available blocks to determine what the function does.
Adapt Karel worlds - With an erroneous program, world state and goal state, the student is asked to modify the goal state (e.g. adding/removing stones, adding/removing walls, changing orientation of Karel, etc.) so the given program is successful.
Modifiable task parameters in the customiser tool
For each of the task types, there are several parameters with which tasks are defined. The Karel Task Customiser tool provides teachers the opportunity to create or adapt tasks by modifying the following parameters, which are enumerated in Figure 4 below:
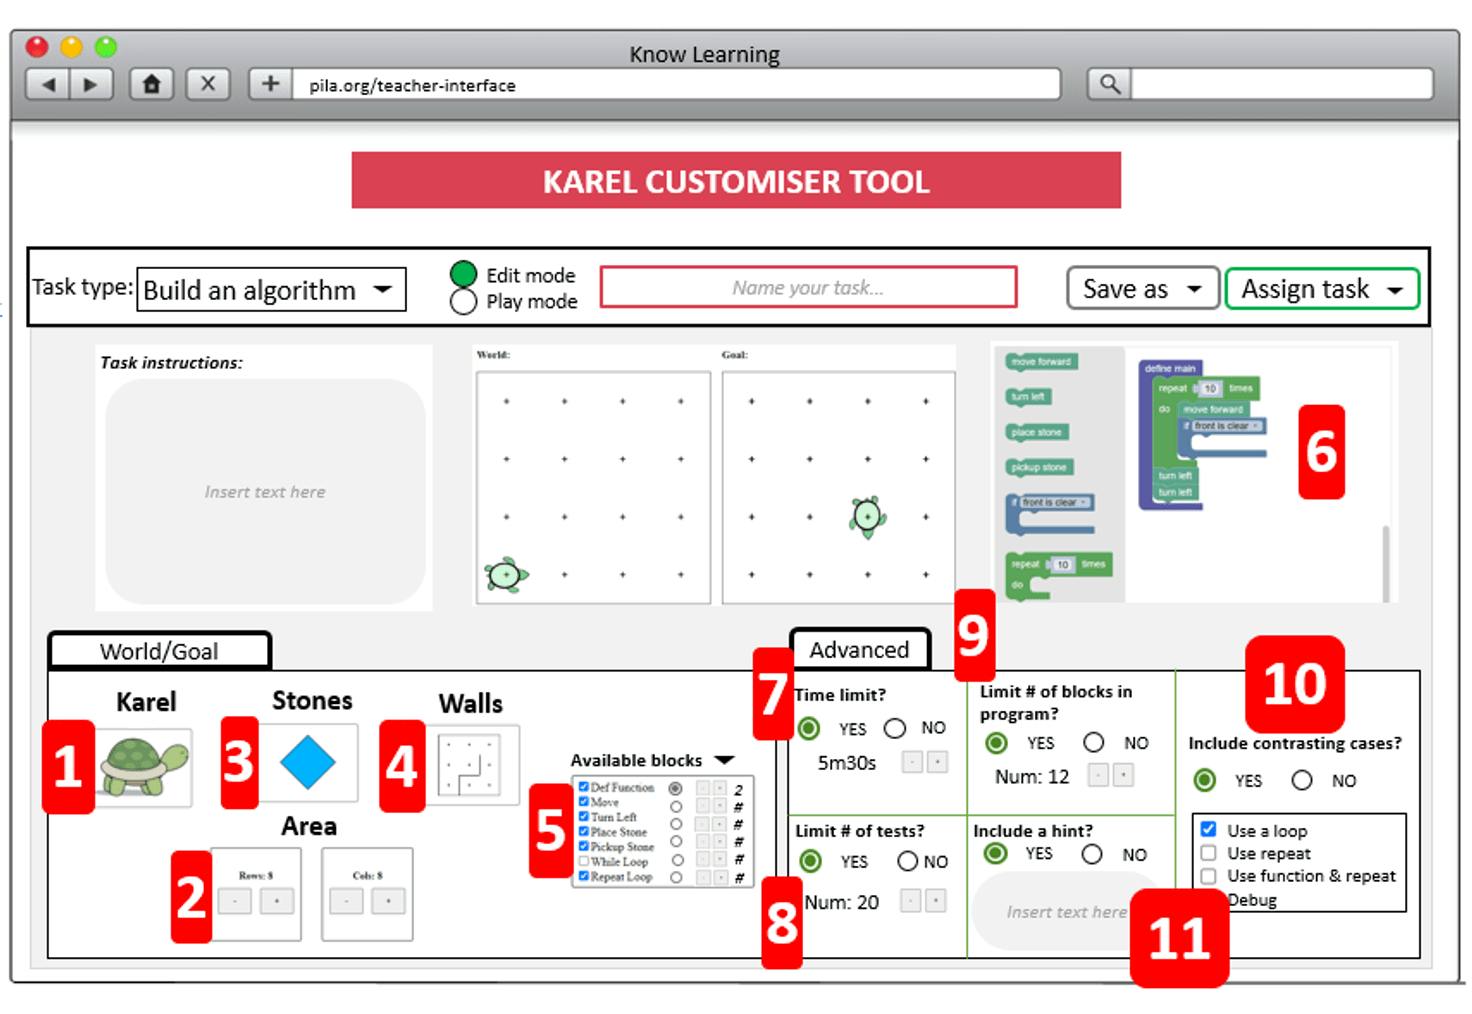
Figure 4. Example of the authoring interface for the Karel Task Customiser tool
World/goal-state parameters:
1. Position of Karel: The teacher can modify the position and direction that Karel is facing in the world and goal states.
2. Area of world and goal states: The world and goal states can be adjusted to contain a specific number of rows and columns.
3. Stones: The number and position of stones can be modified for both the initial world state and goal state.
4. Walls: Walls that constrain the movement of the agents in the world can be added, removed and/or reoriented.
Programming environment:
5. Available blocks: Teachers can designate which blocks students can access and use, and how many of each block they can use.
6. Provision of initial program fragments: A partial segment of a program can be provided to students to complete. Teachers can adjust the segment according to the aim and target difficulty of the task.
7. Time limit: Teachers can decide to limit the amount of time students have to solve the problem.
8. Number of tests: Teachers can decide to restrict the number of tests available for students to use when building their solution.
9. Number of command blocks: Teachers can limit the number of blocks students can use in a program.
Learning resources:
10. Inclusion of ‘contrasting cases’: Tasks can include examples of worked solutions to similar problems. Two types of examples can be provided: a ‘good’ example, showing a correct and efficient way to solve a similar problem, and a ‘bad’ example, showing a typical mistake that the student should avoid.
11. Trigger-based hints: Students can click on a help button to receive a hint. The hint system can have up to two-levels with recommended content: the first level provides a general prompt, while the second level provides more specific information about how to solve the given problem. Teachers will be able to adjust the content of the hints or decide to also deactivate the hint feature.
Reporting dashboards in the Karel application
Students’ performance in Karel will be communicated to teachers and students through a digital dashboard. The dashboard includes multiple sections that summarise student performance at various levels of granularity, as well as allow teachers to replay students’ work and review their progress in a given task. Indicators are populated in real-time using information from learner responses and interaction data. The dashboard aims to help teachers respond to several questions, such as:
· What problems are the students capable of solving?
· What computational problem solving skills do the students master or struggle with?
· How capable are students to develop well-organised and readable programs?
· How are students making progress when they are stuck, and how do they manage their work?
· What new task and/or new task sequences can provide more information on my students’ skills?
The dashboard is organised in four different tabs providing information at different levels of granularity.
Class summary
The class summary (Figure 5) is the default view. It provides an easy-to-read overview of the performance of all students across the different tasks within a particular session. This summary shows task completion (a green cell for completed task, a red cell for incomplete task) for each task in the session. For the more complex tasks, it is also possible to display an indication of how far the students went in solving the task (see the column for task 5).
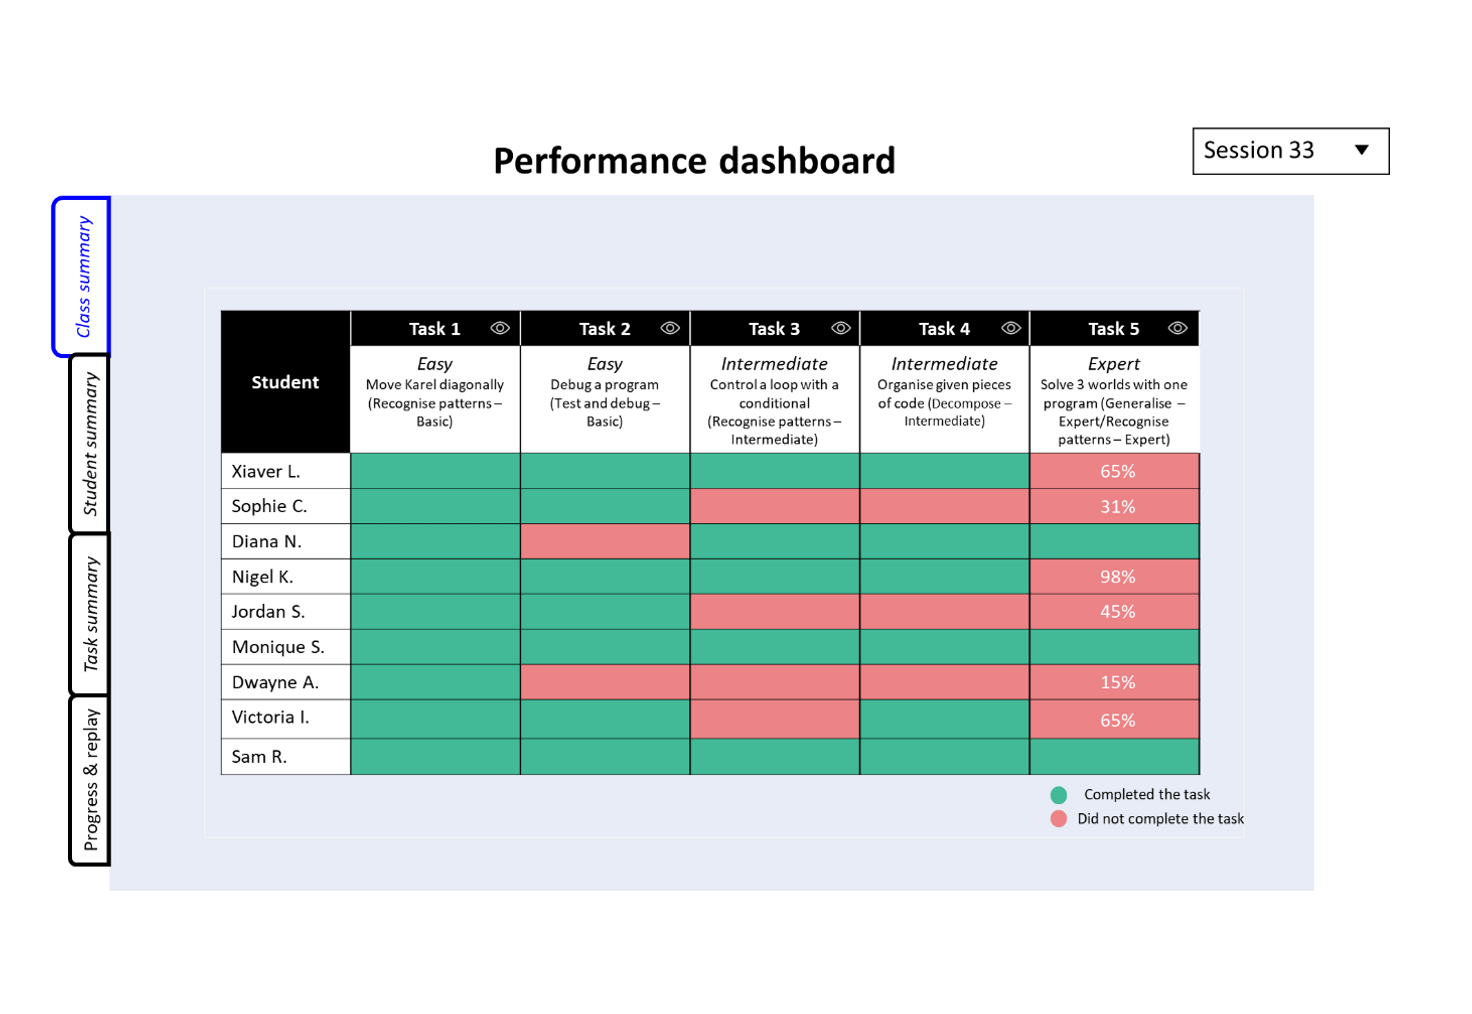
Figure 5. Example of the performance dashboard: Class view
Student summary
The student summary describes the performance of each individual student, indicating how the student performed with respect to the evaluation rubric in the PILA computational problem solving framework. The summary shows what basic, intermediate and expert problems the students was able to solve, for each of the four computation problem solving skills. In the example shown in figure 6, the student Xiaver was able to solve basic and intermediate problems in which he had to demonstrate decomposition, pattern recognition and debugging skills. However, Xiaver was not able to solve an expert task that involved pattern recognition and generalisation. The limited evidence from a short sequence of five tasks indicates that Xiaver has thus not yet reached an expert level in any of the skills. The summary also describes students’ programming behaviour, as evidenced by his use of control flows and testing. In the example, Xiaver had to solve three tasks that required using loops or conditional to address repeating patterns, and the dashboard shows that he used these control flow structures in the three tasks.
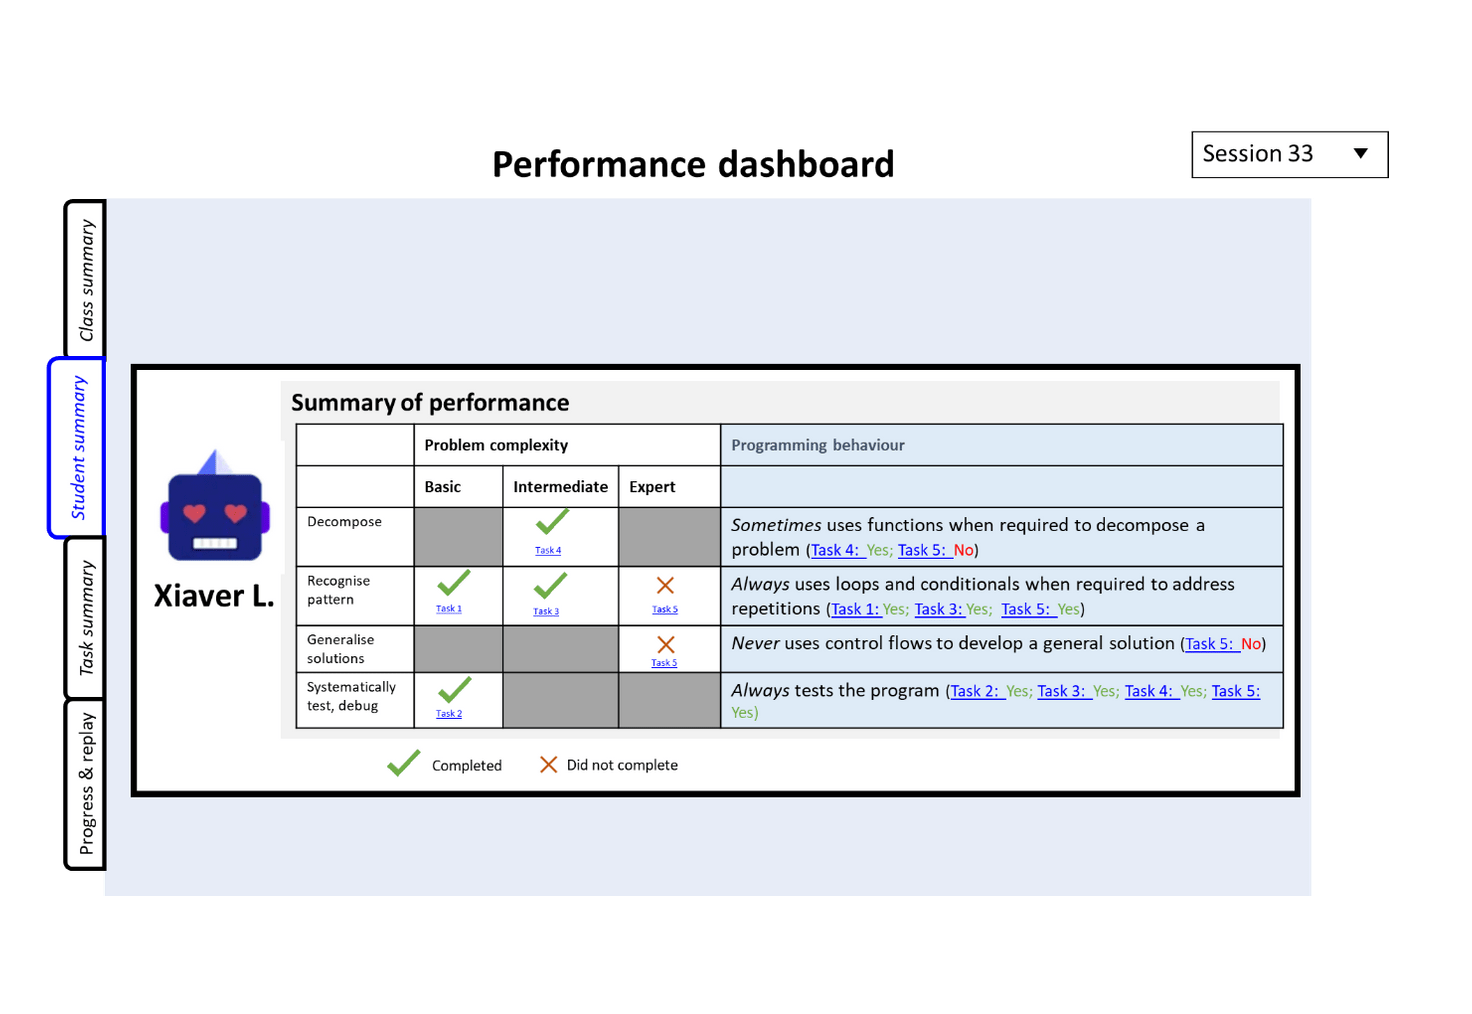
Figure 6. Example of the performance dashboard: Student summary view
Task summary
In the task summary, teachers can get more in depth information on what each student did on each task. Teachers can browse several indicators, that are grouped in four categories. The indicators in the ‘Activity’ category show how students used their time on the task, including their overall time on the task, the time to first action, the time spent inactive and the number of attempts they made. The ‘Control flows’ category indicates whether students included loops, conditionals or functions in their solution. The ‘Support’ category includes indicators on students’ use of the different scaffolds provided in Karel (hints and worked examples), and whether they responded to the automated feedback. Finally, the ‘Self-evaluation’ indicators summarise responses to survey questions at the end of the assessment that ask the students to evaluate their achievement and report on their engagement and feelings during the experience.
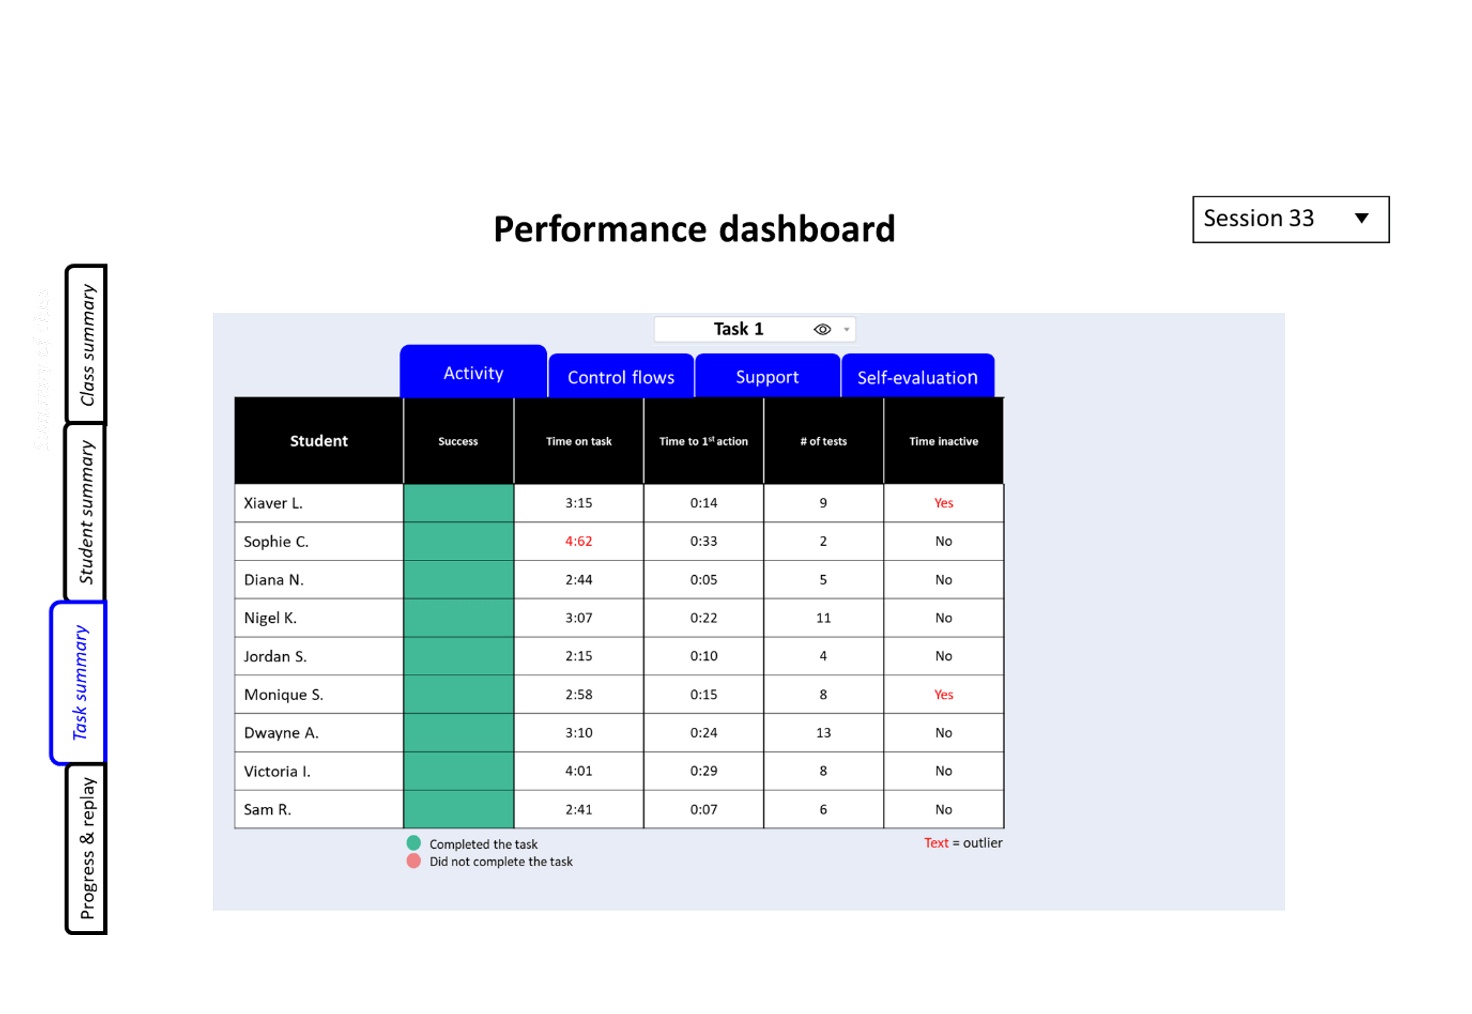
Figure 7. Example of the performance dashboard: Task summary view
Progress and replay summary
In this section of the dashboard, the teacher can select a task and a student to replay his/her work on the task, as well as visualise the progress the student made to solve the task (see Figure 8). The teacher can replay particular phases of the students’ work by dragging the timer along the time elapsed bar. They are guided in the selection of what to replay by a progress chart, that shows how much and how fast students progressed towards a functional solution, and the timing of other actions, such as conducting tests or browsing examples.
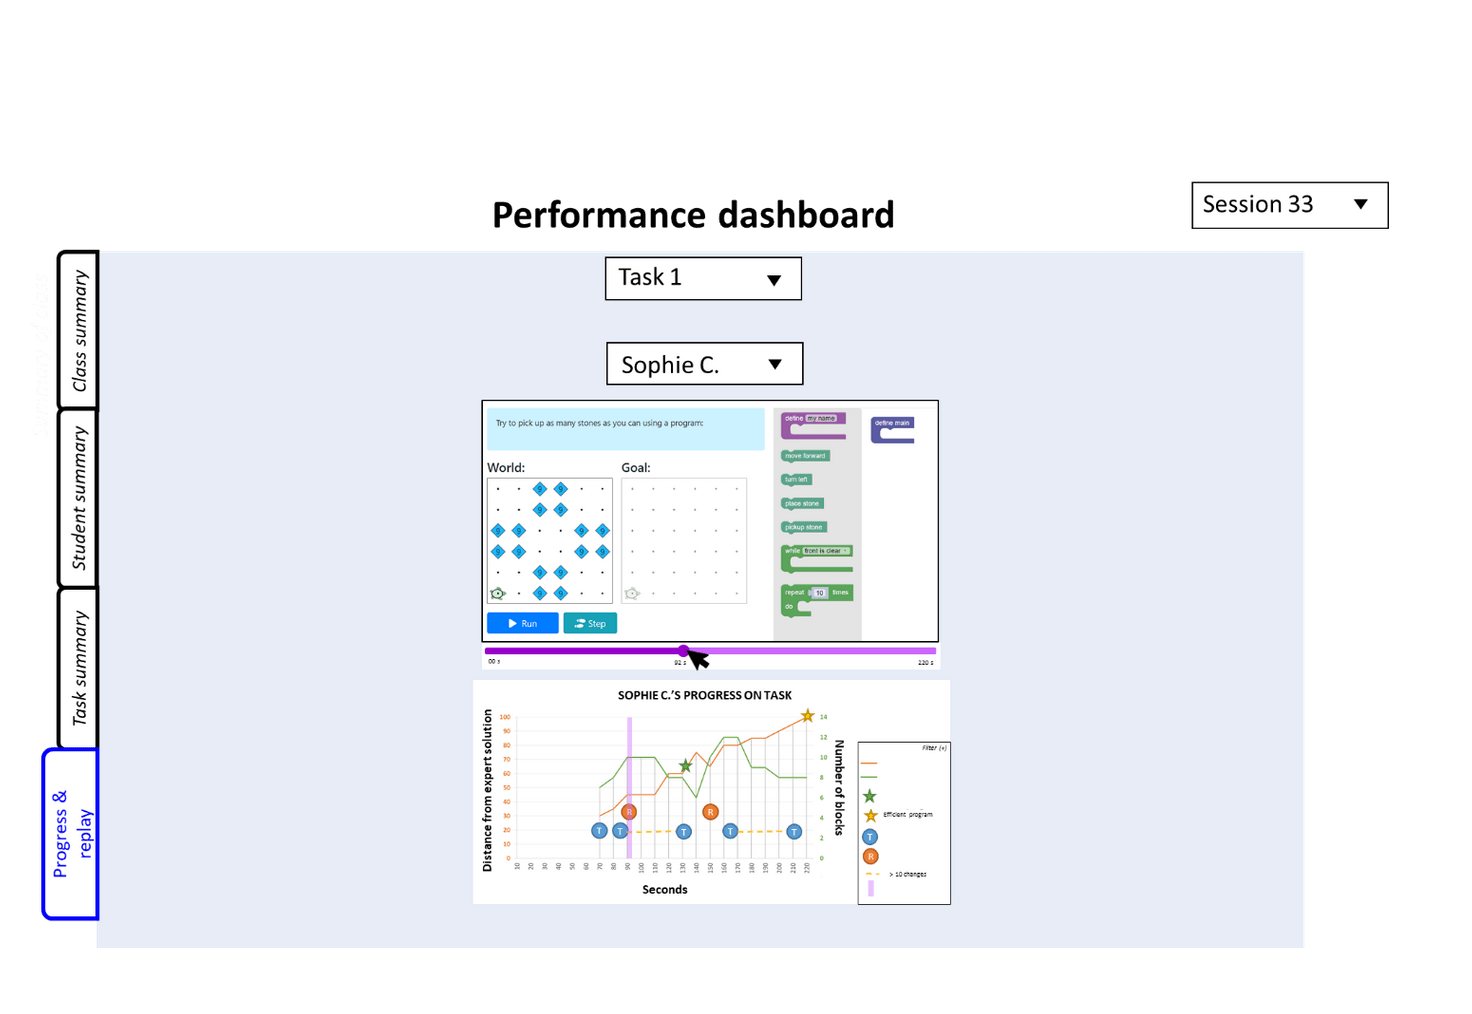
Figure 8. Example of the performance dashboard: Progress and replay view
Karel the Turtle Application Guide
‘Karel’ is a PILA application that measures students’ computational problem solving skills. The application asks students to build programs in a block-based visual programming interface in order to instruct a robot in the form of a turtle (“Karel”) to perform certain actions. Karel understands four basic instructions: “move forward”, “turn left”, “place stone”, and “pick-up stone”, in a grid-like world. These programmed actions can be seen as abstractions of various navigational problems in the real world.
In the Karel application, students will first complete a tutorial and a series of short, scaffolded tasks where they are introduced to the environment (i.e. visual programming interface) and learn some of the basic concepts involved in computational problem solving. Students then progress to more complex and open-ended challenges where they have to apply simultaneously multiple skills and concepts.
The Karel application has a “low floor and high ceiling”, meaning students who have minimal programming knowledge and/or computational thinking skills can nevertheless productively interact with the environment because of its intuitiveness and simplicity (i.e. low floor), while at the same time this same environment allows for the design of high complexity tasks that can challenge even expert programmers (i.e. high ceiling). The application accomplishes this by using a block-based programming environment.
Key elements of the digital environment
The Karel assessment application is composed of a visual block-based programming interface and the ‘task hub’. Figures 1 and 2 show the current design of these two interfaces.
Figure 1. Block-based programming interface
1. Block-based program builder: Students can drag and drop pre-defined blocks of code into the program builder in order to build programs that instruct Karel. Students will have access to a certain set of block types and functionalities according to the design of a given task.
2. World state: This is the grid-like world within which Karel the robot lives and executes actions. Each cell in the grid can be empty or contain a finite amount of stones. Cells can be separated by a wall that blocks Karel from moving forward. The world state shows the current arrangement of stones and walls, and the position and orientation of Karel. The program that students build and ‘run’ will result in the world state changing, modelling Karel’s behaviour in the world.
3. Goal state: This is the desired state of the world, which is defined by the arrangement of stones and walls, and the position and orientation of Karel.
4. ‘Run’ button: The run button allows students to execute the program in the program builder as a simulation of Karel’s behaviour in the ‘world’.
5. Pop-up messages: These messages automatically appear after the student tests a program to communicate errors (e.g. ‘front is blocked’ or ‘your program is empty’) or provide feedback (e.g. ‘not quite’ or ‘success’) to the student.
6. Task instructions: Task instructions succinctly state what students must do in the task and what the desired goal is. The goal can also be represented visually, displaying the desired final state of the world upon task completion (see #3).
7. Home button: This button allows students to return to the task hub (see Figure 2 for an example of the task hub).
8. ‘Worked examples’ tabs: The worked examples illustrate a similar task, providing one ‘good’ example that demonstrates a possible approach to solving the problem and one ‘bad’ example that demonstrates a typical mistake.
9. ‘Hint’ button: The hint button provides students with a hint system guiding students on how to successfully progress through the task.
10. Time remaining clock: This provides students with an indication of how much time remains to complete the task.
The ‘task hub’ (Figure 2) allows students to navigate between tasks. As students complete tasks, new tasks become unlocked. Learning tasks (e.g. tasks 1-6 from the top in Figure 2) aim to introduce specific concepts and help develop the target skills throughout this ‘phase’. Once the students complete the targeted number of learning tasks, the challenge task will be unlocked. The challenge task is a complex, open-ended task that will ask students to apply what they practices in the previous tasks.
Figure 2. Task Hub
What skills can we assess with Karel?
The tasks in the Karel application have been designed to provide evidence on the computational problem solving skills described in the PILA Computational Problem Solving Framework. Each task is mapped to a given cell in the evaluation rubric presented in the Framework. Students’ capacity to solve a given task in Karel is considered evidence that they can do what is described in the corresponding cell of the rubric.
Here are a few examples of the evidence that can be collected from Karel for each of the skills:
Decompose Problems
- The student can identify and put in the right order relevant sub-goals for a given problem from given lists of sub-goals
- The student can use a drawing tool to indicate different trajectories that Karel can follow in the world to collect all the stones*
Recognise Patterns
- The student solves a problem that requires using nested repetitions
- The student can tag repeating patterns in the world using a drawing tool*.
Generalise Solutions
- The student can design a program that achieves the goal state in multiple different worlds
- The student saves functions in a function bank and uses them across different tasks*
Systematically Test and Debug
- The student can fix an erroneous program
- The student tests the program in chunks as they work
*under development
What information can teachers expect on how students manage their learning and stay engaged?
In addition to demonstrating their proficiency with computational problem solving skills and associated concepts (sequences, conditionals, loops and functions), students will need to be capable of effectively regulating their work on the digital platform, and maintaining an adequate level of engagement during the assessment experience.
We provide an indication for the information that will be collected on the way in which students:
Use resources
- The student accesses a worked example after making at least one attempt to build a program
- The student requests a hint after attempting to solve the problem
Respond to feedback
- The student performs actions that are consistent with the automated feedback (for example, the student reduces the number of blocks in the program after receiving the feedback that the program could be more efficient)
Evaluate own performance
- The student correctly evaluates his/her own performance in the challenge task.
Stay engaged
- The student does not remain inactive for long periods of time (e.g. more than one minute at a time)
- The student reports feeling engaged during the task
How can teachers use Karel?
There are three principal ways in which teachers can use the Karel application, which include:
- Assessment experiences defined by experts that teachers can assign to their class to complete during classtime or as homework. These experiences typically last around one hour. They contain a meaningful sequence of tasks that make students practice a defined set of skills and concepts, and progressively increase in difficulty. Teachers can assign their students multiple assessment experiences, possibly intervalled with other teaching practices (e.g. additional lessons, class discussion, etc.), and examine the extent to which students make progress from one experience to the next.
- Assessment experiences defined by teachers with the PILA Assignment tool. This tool allows teachers to combine discrete tasks that have been developed by experts, other teachers/researchers, or the teacher themselves (using the Karel Task Customiser tool; see #3 below), in order to create tailored assessment experiences for their students. Teachers can design new assessment experiences that, for example, have alternative sequences of tasks of varied difficulty, focus on one specific concept or skills, or span a desired length of time (e.g. a 20-minute experience that comprises four 5-minute discrete tasks).
- Assessment tasks defined by teachers. The Karel Task Customiser tool allows teachers with no programming experience to create their own task by modifying an existing task. By using the tool, teachers can modify several parameters, such as the task instructions, the world and goal states, and available learning resources. Any new task that is created through the customiser tool will automatically contain the necessary data collection capabilities, ensuring information on student performance can be displayed in the digital dashboards for teachers and students to review.
The tasks in Karel are classified according to the computational problem solving skills they target, their level of complexity, as well as the task type (see below), creator (e.g. PILA expert) and the characteristics of a solution that an expert would formulate. Each task created in the module has to include an ‘expert’ solution, and this section of the metadata is populated automatically extracting features of the expert solution. Task authors can also provide a short description of the task.
Figure 3. Metadata for Karel tasks
Karel Task Types
The PILA computational problem solving module includes several types of tasks designed to assess computational problem solving as defined in the framework. Here is a short description of each task type in this module, and examples that are being implemented in Karel World:
Open-response or multiple choice questions
- With a given program and initial world state, the student is asked to predict the goal state;
- With a given initial world state and goal state, the student is asked to infer from a list of programs which program would produce the goal state;
- With a given initial world state and “functioning” program for one goal state, the student is prompted to select from a set of alternative goal states the one(s) that can be accomplished with the same program;
- With a given erroneous program, the student is asked to identify one (or more) errors;
- With a given program with numbered lines of blocks, the student is asked to describe what a selected set of lines accomplishes in the world.
Programming tasks
- Build a program from scratch with a combination of the following affordances:
· Move Karel;
· Pick up/Place stone;
· Repetition block (run the inside function [x] times);
· While statement;
· If/else statement;
· Create a custom function (with a label) - Complete a partially-built program;
- Fix an erroneous program;
- Modify a program to adjust to different goal states in the same or different worlds.
Parson’s problem - All of the blocks of the program and the number of times they need to be used are defined but the blocks are not arranged in any specific order. Students are asked to arrange the blocks to create a functioning program. The task may include visual blocks or natural language to represent the discrete steps.
Coming in 2022:
Draw in the world - Students are prompted to decompose the problem visually, for example by drawing walls around certain regions of the grid, or by drawing the shortest path that Karel can follow to collect all stones.
Black box simulations - With a given “black box” function (i.e. a function block that students can use but that does not reveal what it does), students are asked to use the Karel environment and additionally available blocks to determine what the function does.
Adapt Karel worlds - With an erroneous program, world state and goal state, the student is asked to modify the goal state (e.g. adding/removing stones, adding/removing walls, changing orientation of Karel, etc.) so the given program is successful.
Modifiable task parameters in the customiser tool
For each of the task types, there are several parameters with which tasks are defined. The Karel Task Customiser tool provides teachers the opportunity to create or adapt tasks by modifying the following parameters, which are enumerated in Figure 4 below:
Figure 4. Example of the authoring interface for the Karel Task Customiser tool
World/goal-state parameters:
1. Position of Karel: The teacher can modify the position and direction that Karel is facing in the world and goal states.
2. Area of world and goal states: The world and goal states can be adjusted to contain a specific number of rows and columns.
3. Stones: The number and position of stones can be modified for both the initial world state and goal state.
4. Walls: Walls that constrain the movement of the agents in the world can be added, removed and/or reoriented.
Programming environment:
5. Available blocks: Teachers can designate which blocks students can access and use, and how many of each block they can use.
6. Provision of initial program fragments: A partial segment of a program can be provided to students to complete. Teachers can adjust the segment according to the aim and target difficulty of the task.
7. Time limit: Teachers can decide to limit the amount of time students have to solve the problem.
8. Number of tests: Teachers can decide to restrict the number of tests available for students to use when building their solution.
9. Number of command blocks: Teachers can limit the number of blocks students can use in a program.
Learning resources:
10. Inclusion of ‘contrasting cases’: Tasks can include examples of worked solutions to similar problems. Two types of examples can be provided: a ‘good’ example, showing a correct and efficient way to solve a similar problem, and a ‘bad’ example, showing a typical mistake that the student should avoid.
11. Trigger-based hints: Students can click on a help button to receive a hint. The hint system can have up to two-levels with recommended content: the first level provides a general prompt, while the second level provides more specific information about how to solve the given problem. Teachers will be able to adjust the content of the hints or decide to also deactivate the hint feature.
Reporting dashboards in the Karel application
Students’ performance in Karel will be communicated to teachers and students through a digital dashboard. The dashboard includes multiple sections that summarise student performance at various levels of granularity, as well as allow teachers to replay students’ work and review their progress in a given task. Indicators are populated in real-time using information from learner responses and interaction data. The dashboard aims to help teachers respond to several questions, such as:
· What problems are the students capable of solving?
· What computational problem solving skills do the students master or struggle with?
· How capable are students to develop well-organised and readable programs?
· How are students making progress when they are stuck, and how do they manage their work?
· What new task and/or new task sequences can provide more information on my students’ skills?
The dashboard is organised in four different tabs providing information at different levels of granularity.
Class summary
The class summary (Figure 5) is the default view. It provides an easy-to-read overview of the performance of all students across the different tasks within a particular session. This summary shows task completion (a green cell for completed task, a red cell for incomplete task) for each task in the session. For the more complex tasks, it is also possible to display an indication of how far the students went in solving the task (see the column for task 5).
Figure 5. Example of the performance dashboard: Class view
Student summary
The student summary describes the performance of each individual student, indicating how the student performed with respect to the evaluation rubric in the PILA computational problem solving framework. The summary shows what basic, intermediate and expert problems the students was able to solve, for each of the four computation problem solving skills. In the example shown in figure 6, the student Xiaver was able to solve basic and intermediate problems in which he had to demonstrate decomposition, pattern recognition and debugging skills. However, Xiaver was not able to solve an expert task that involved pattern recognition and generalisation. The limited evidence from a short sequence of five tasks indicates that Xiaver has thus not yet reached an expert level in any of the skills. The summary also describes students’ programming behaviour, as evidenced by his use of control flows and testing. In the example, Xiaver had to solve three tasks that required using loops or conditional to address repeating patterns, and the dashboard shows that he used these control flow structures in the three tasks.
Figure 6. Example of the performance dashboard: Student summary view
Task summary
In the task summary, teachers can get more in depth information on what each student did on each task. Teachers can browse several indicators, that are grouped in four categories. The indicators in the ‘Activity’ category show how students used their time on the task, including their overall time on the task, the time to first action, the time spent inactive and the number of attempts they made. The ‘Control flows’ category indicates whether students included loops, conditionals or functions in their solution. The ‘Support’ category includes indicators on students’ use of the different scaffolds provided in Karel (hints and worked examples), and whether they responded to the automated feedback. Finally, the ‘Self-evaluation’ indicators summarise responses to survey questions at the end of the assessment that ask the students to evaluate their achievement and report on their engagement and feelings during the experience.
Figure 7. Example of the performance dashboard: Task summary view
Progress and replay summary
In this section of the dashboard, the teacher can select a task and a student to replay his/her work on the task, as well as visualise the progress the student made to solve the task (see Figure 8). The teacher can replay particular phases of the students’ work by dragging the timer along the time elapsed bar. They are guided in the selection of what to replay by a progress chart, that shows how much and how fast students progressed towards a functional solution, and the timing of other actions, such as conducting tests or browsing examples.
Figure 8. Example of the performance dashboard: Progress and replay view